The $ZAMA spike, audited
1 · Verdict summary
| Metric | Value | Read |
|---|---|---|
| Attention vs 30d baseline (event day) | ~6x (2.1M interactions vs ~350k norm) | major spike |
| Spam volume vs the token's own norm | 2.0x | fresh wave |
| Creator concentration (top 3 share) | 98% of interactions | crowd costume |
| Sentiment | 100 (unanimous positive) | uniformity tell |
| Price response (spike day, close-to-close) | $0.051 to $0.051 | none |
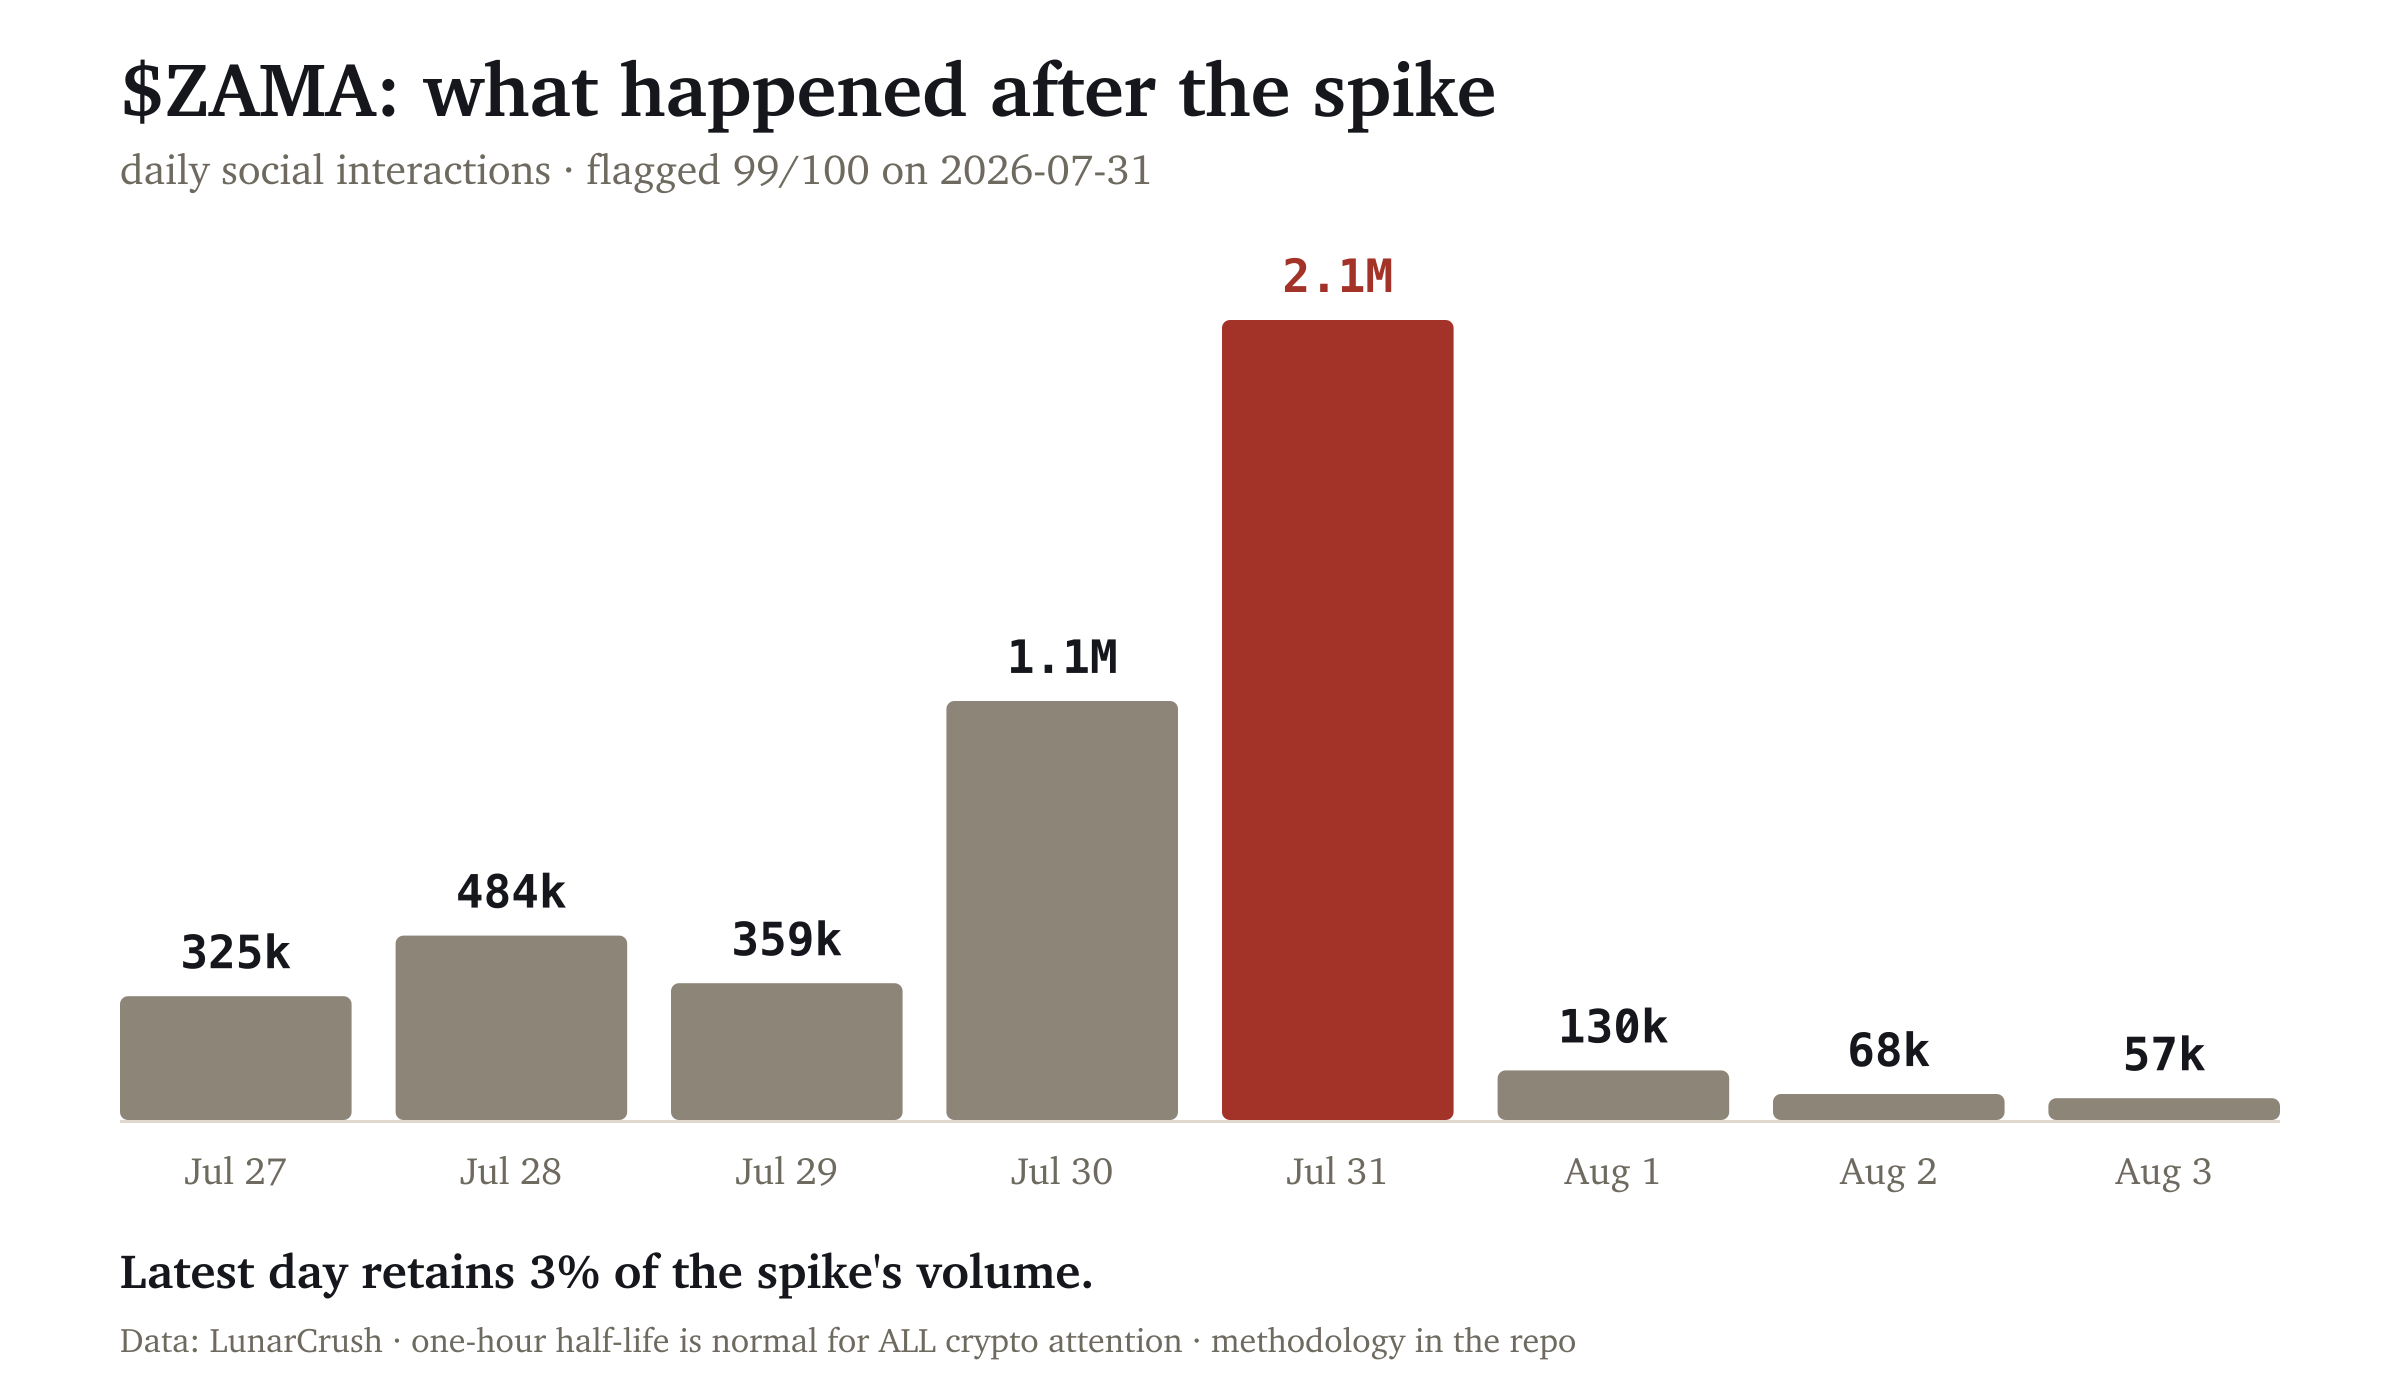
| Attention floor after event vs before | ~60-80k/day vs ~350k/day | crater, not residue |
| New wallets created (Ethereum + BNB Chain) | 73, from 2.1M interactions | 35 per million |
2 · What happened next
Attention decay itself proves nothing: my published half-life study found ALL crypto attention dies fast, real or rented (one-hour median half-life from the peak). The diagnostic isn't the fall, it's the floor. Genuine adoption events leave the attention baseline durably higher: across 5,000+ historical spikes, the median event settles about 30% above the prior floor. This event left the token's attention below where it started. Whoever arrived on July 31 did not stay, did not follow, and did not come back.
3 · Did anyone actually show up?
Social data can only tell you what was said. The stronger test is whether the conversation produced anything onchain: real discovery converts some share of attention into wallets that never held the token before. So the same window was measured against first-time token receipts on both of the token's EVM deployments.
The July 31 event produced 73 new wallets across Ethereum and BNB Chain, from 2.1 million interactions. That is 35 wallets per million. For comparison, a smaller spike eight days earlier — 1.5 million interactions, less attention — brought in 449 wallets, roughly 302 per million. On ordinary days this token converts attention at about 979 per million.
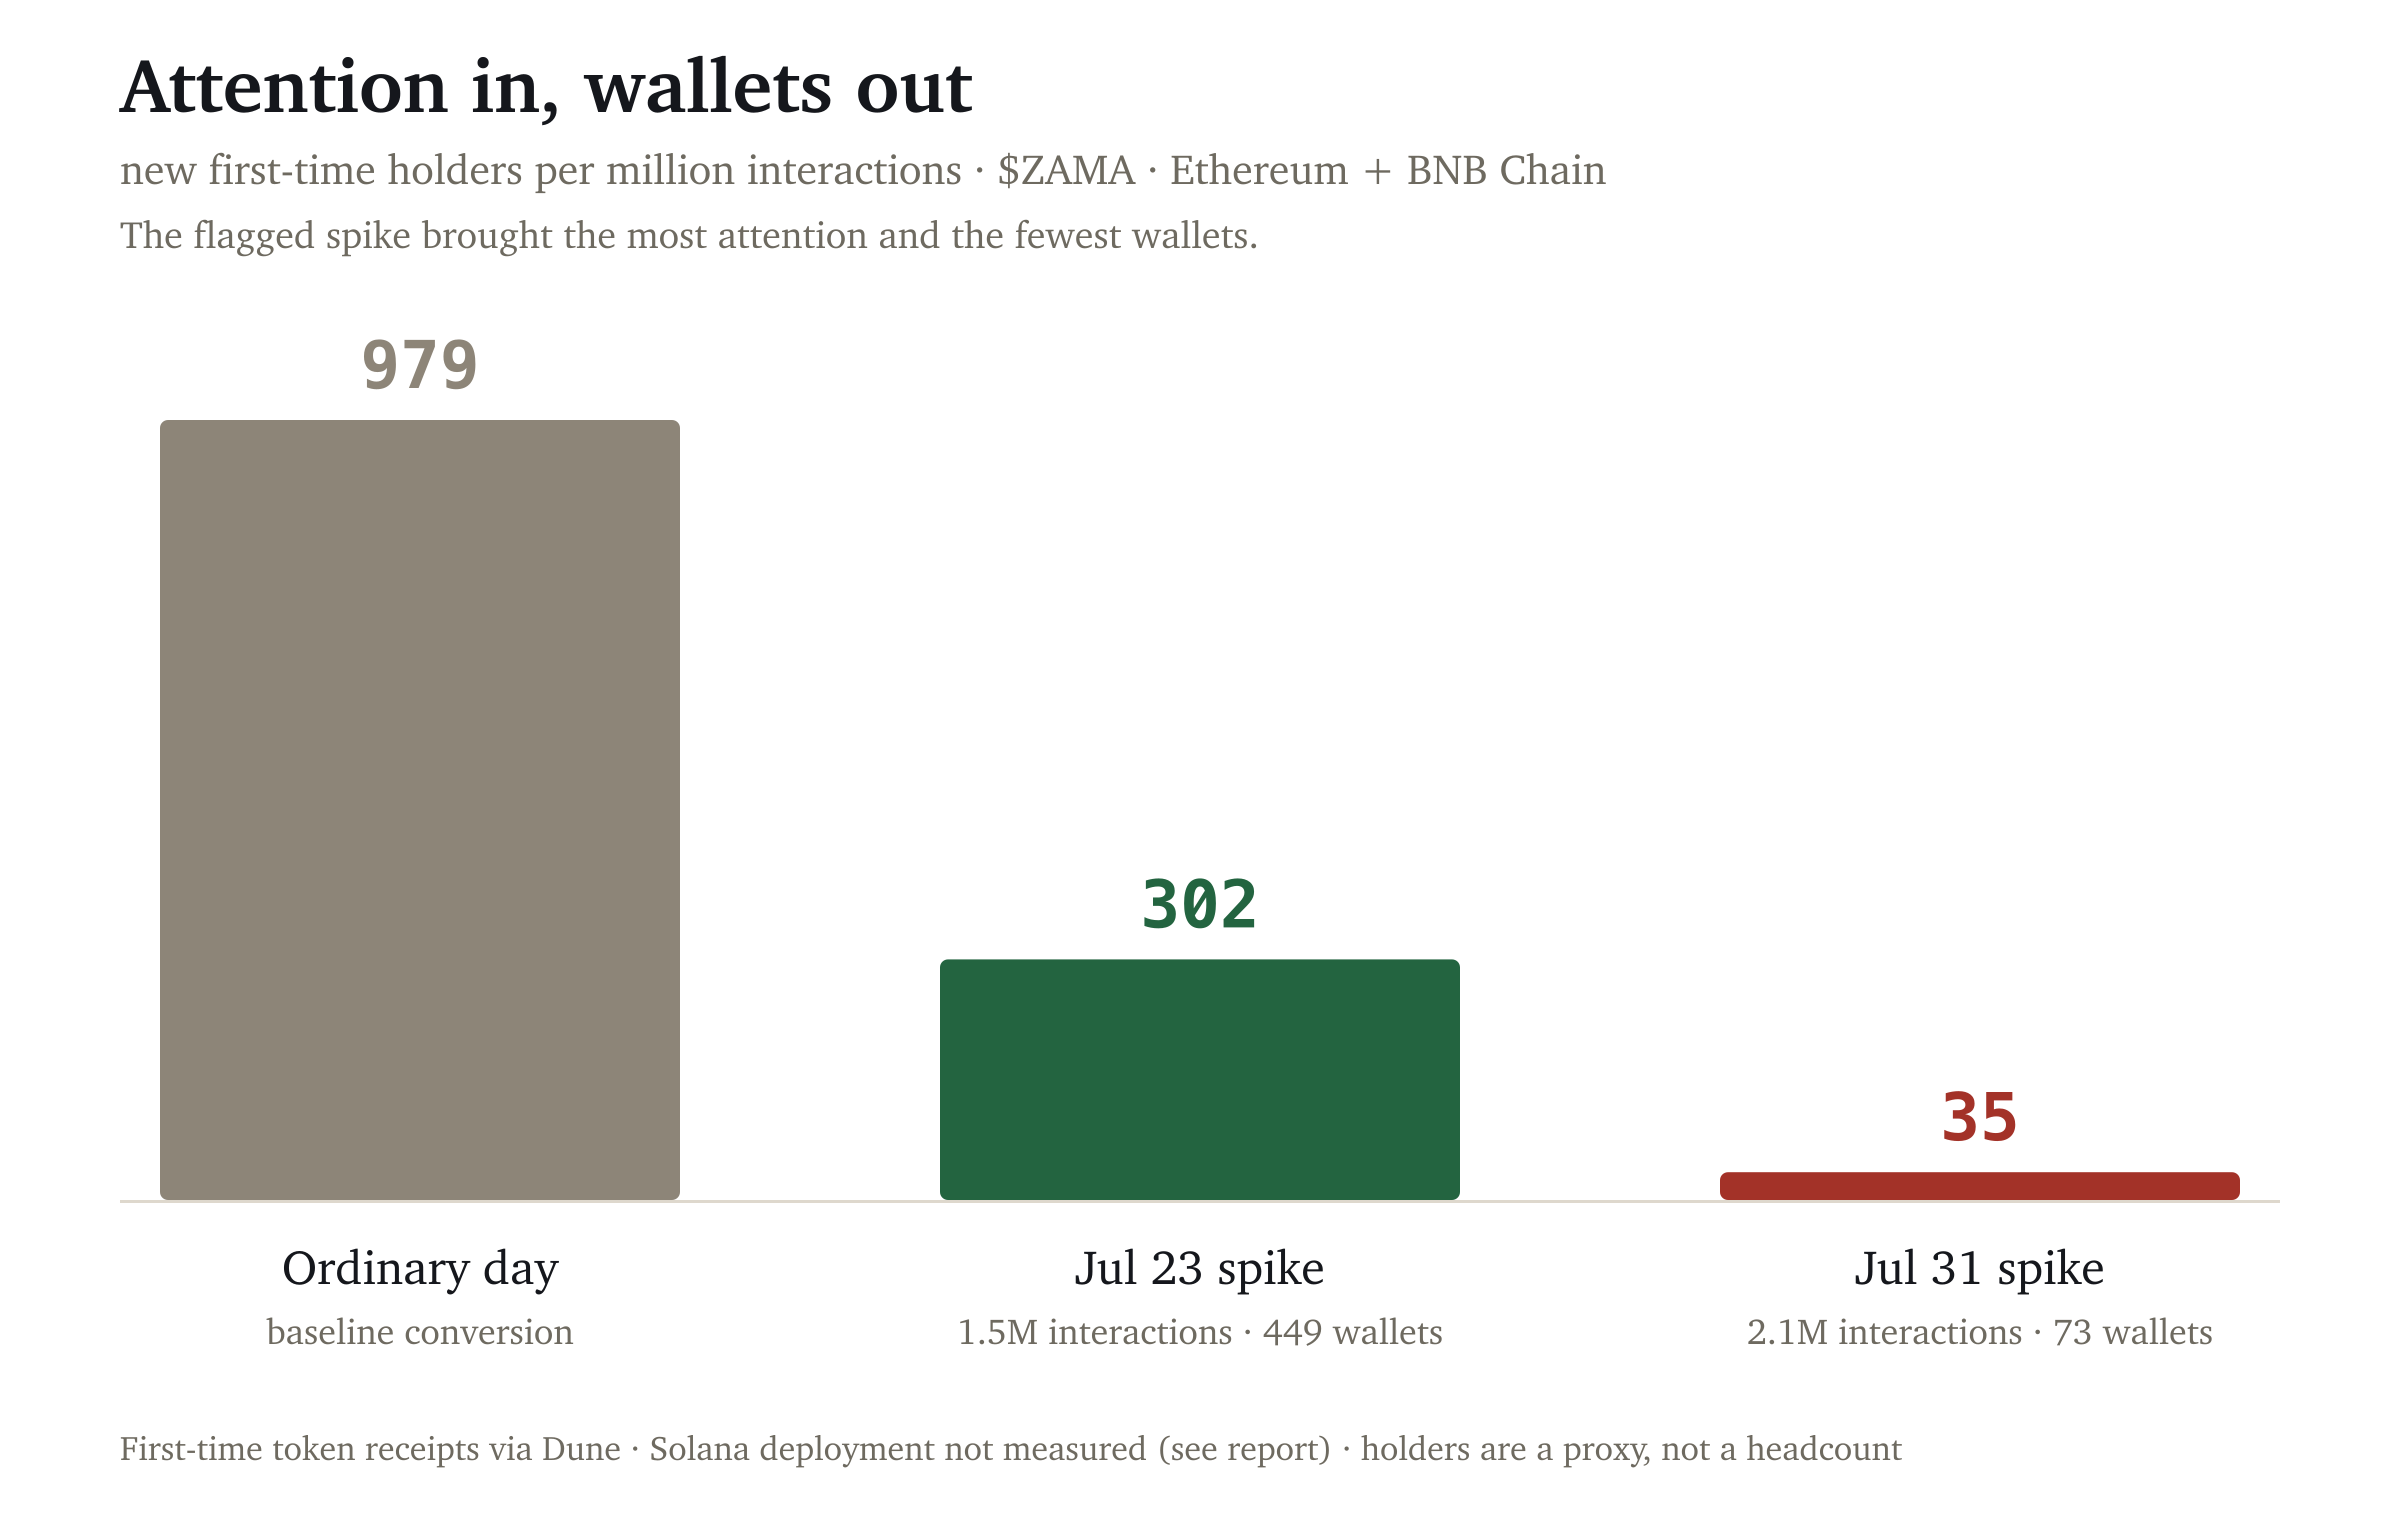
The flagged event drew the most attention of any day in the window and produced the fewest wallets per unit of it, by an order of magnitude. Two independent measurements — who was posting, and who actually bought — point the same direction, which is the strongest form of evidence this method produces.
4 · What this audit cannot determine
On the onchain figures: holder counts are a proxy, not a headcount. One person can hold several wallets, airdrops mint holders who never engaged, and anyone buying through an exchange never appears onchain at all. This token also has a Solana deployment that the EVM-based method does not cover, so the wallet counts above are a floor, not a total; the comparison holds because every figure is measured the same way on the same chains.
Post-level data measures amplification, not its source. A paid bot campaign, third-party engagement farming, coordinated advocacy, and algorithmic amplification can produce overlapping signatures; this report claims none of them specifically. It also says nothing about the project's technology or team, which may be excellent: conversation authenticity and product quality are independent axes. A real catalyst and rented amplification can co-occur, and the evidence here is consistent with that combination. Payment does not influence conclusions; this specimen was unpaid and published because the event was publicly notable.
5 · Provenance
Every number above comes from the same pipeline behind the daily public verdicts: the detector flagged this event live on July 31, the follow-up chart was generated automatically three days later, and the residue benchmark comes from published research across 5,000+ historical spikes. Onchain figures are first-time token receipts queried directly against indexed chain data, with contract addresses resolved per deployment rather than assumed. Paid reports include a reproduction appendix so you can verify every figure.