$W, audited
1 · Verdict summary
| Metric | $W | Read |
|---|---|---|
| Creator concentration (top 3) | 68.7% | 56th percentile, at the peer median |
| Cross-token accounts | 4.2% | 22nd percentile, below the 23.0% median |
| Repeated wording across accounts | 3.7% | 80th percentile, small in absolute terms |
| Spam vs the token's own norm | 0.356 vs 0.333 (1.07x) | flat |
| Holders on Ethereum | 9,556 | cross-checked at 9,555, 0% apart |
| Holders with $100 or more | 2,064 | 21.6% of the headline count |
| Largest holder | 24.2% | a vesting lockup contract |
| Second largest | 20.5% | an exchange address |
| Share of the token on this chain | 10.6% | most of it is elsewhere |
| Manufactured score | 25/100 | organic (under 30) |
Score computed with the published formula in the open hype-detector project: spam lift 1.3, spam share 7.1, concentration 16.8, sentiment uniformity 0.0. Concentration is ranked against same-size peers, so a token at its peer median is not charged for being small.
2 · Who is talking
Measured over 107 posts on the verified topic wormhole. The bare w topic was checked and rejected before any figure was computed: 0% of its posts are about a token, because a single letter collides with everything.
Top-three creator concentration is 68.7%, the 56th percentile of 41 same-size peers against a median of 64.4%. That is the middle of the pack, and the loudest accounts are ordinary crypto commentators rather than one dominant voice, the largest holding 18.6% of interactions.
Attention rose with the price. People posting went from 112 a day to 207, and interactions from 74,871 a day to 199,667.
3 · Cross-token accounts
4.2% of interactions come from accounts that also post about three or more other tokens. Against same-size peers that is the 22nd percentile, below the 23.0% median. The accounts carrying this conversation are less promiscuous than the typical token of this size, not more.
On comparing against Bitcoin. Against a live Bitcoin control pulled the same day, $W runs 14.2x the control's spread-account share. That is the wrong comparison and it is reported here so nobody mistakes it for the finding. Bitcoin has an enormous diffuse audience, so its spread share is near zero by construction, and ranking a $165M token against it charges the token for being small. The size-bias measurement is published. The band percentile is the figure that means something.
4 · Repeated wording
3.7% of posts are near-duplicates across more than one account, the 80th percentile of its band against a median of 0.0%. Elevated in rank and small in size. A token in this band normally carries none at all, so the rank overstates how much is actually present.
5 · Supply, and what the contract actually holds
The Ethereum ERC-20 total supply is 1,062,939,501 W, which is 10.6% of the 10,000,000,000 global total and 16.1% of circulating. Most of Wormhole lives elsewhere, principally Solana. Everything in this section describes the Ethereum slice, and nothing in it should be read as describing the token as a whole.
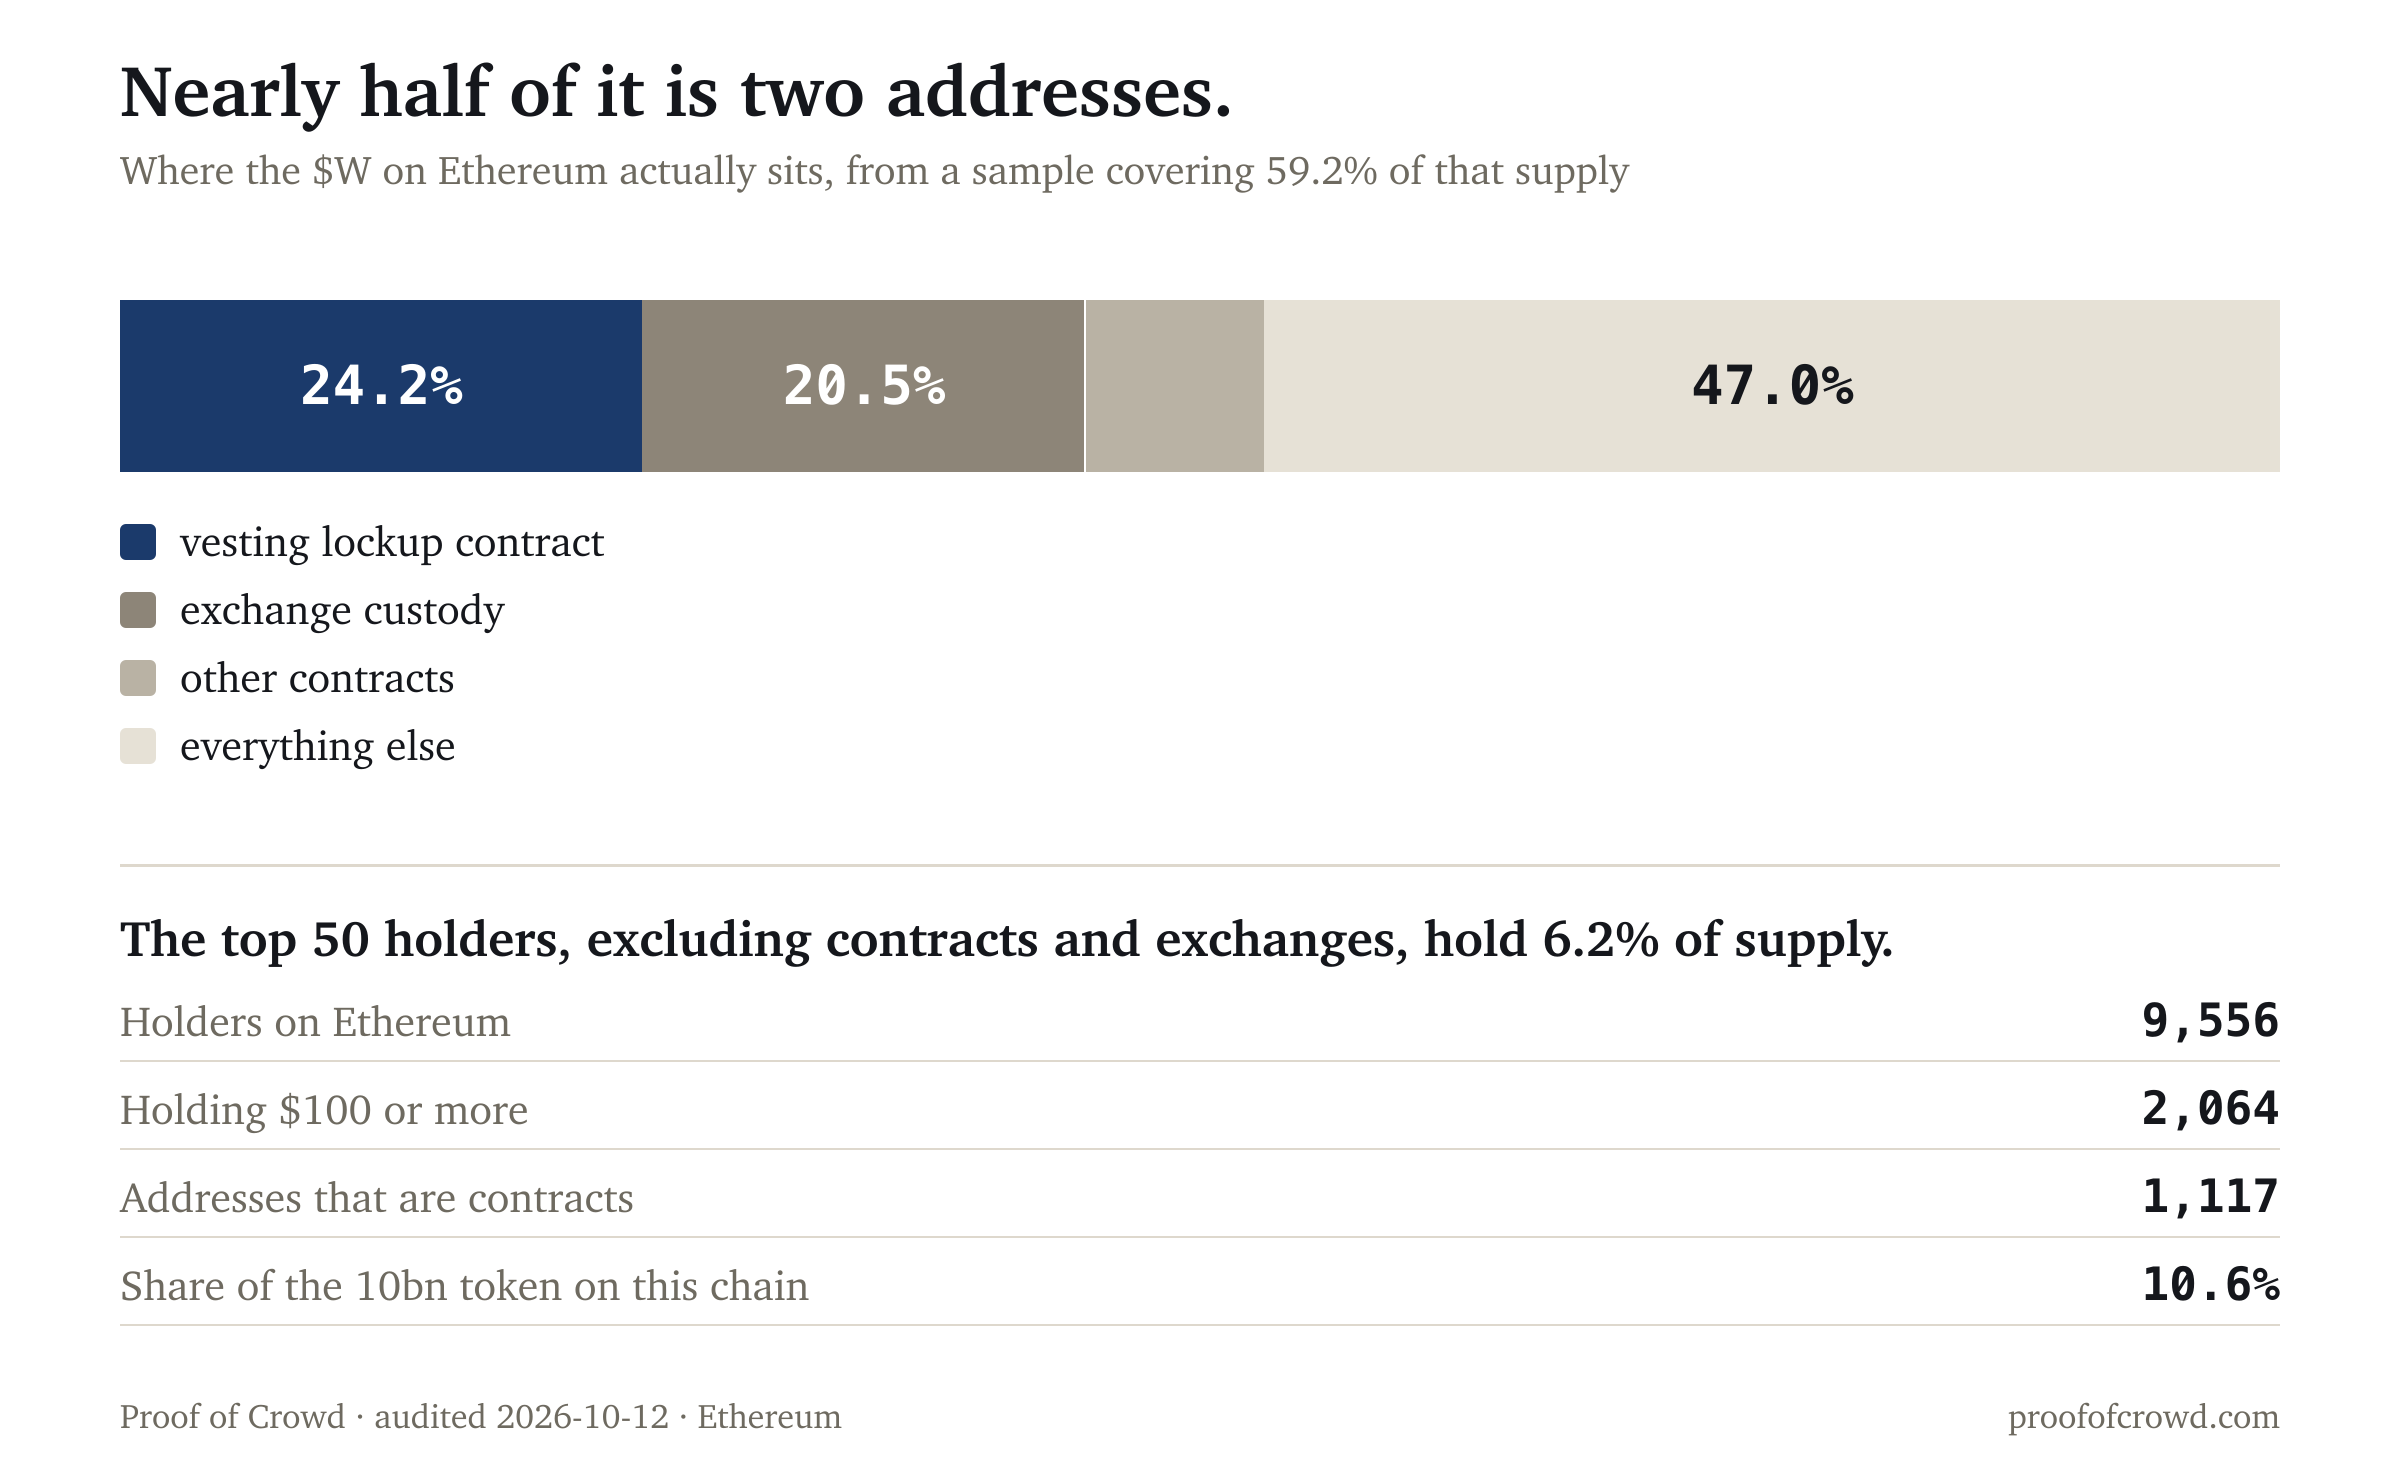
From a top-50 sample covering 59.2% of that supply, nearly half sits in two addresses: 24.2% in a VotingTokenLockupPlans vesting contract and 20.5% at an address classified as an exchange. Across the sample, 32.5% is in contracts and 20.5% at exchanges, and the top 50 excluding both holds 6.2% of supply.
Neither of those is a finding about honesty. A vesting contract is what a locked allocation is supposed to look like, and exchange custody is where tradable supply lives. What it does mean is that the float available to ordinary holders is considerably smaller than the contract's headline supply suggests.
Holder distribution, enumerated across all 9,557 addresses:
| Position size | Addresses | Share |
|---|---|---|
| $10k or more | 93 | 1.1% |
| $1k to $10k | 388 | 4.6% |
| $100 to $1k | 1,583 | 18.8% |
| $10 to $100 | 2,159 | 25.6% |
| $1 to $10 | 1,493 | 17.7% |
| under $1 | 2,719 | 32.2% |
2,064 addresses hold $100 or more, 21.6% of the 9,556 headline count. A third hold under a dollar. Dust is normal for any ERC-20 and is not evidence of anything by itself.
1,117 of the 9,557 addresses are contracts, 11.7% of what an explorer counts as a holder. Counting those inflates the number a project can quote.
6 · What this audit cannot determine
It does not identify who is behind any account, and it does not establish motive. It takes no view on the token's technology, its bridge, or its team.
One gap remains. Retention has since been measured and is in the appendix below, added 2026-10-17. It was listed here as a gap when this report was published, because the scan had covered 1.3% of the contract's history before the upstream data service stopped answering. The Solana side is not audited, because the reconstruction tooling covers EVM chains only, so 89.4% of the token's supply sits outside what was measured here.
8 · Retention, added 2026-10-17
The gap stated in section 6 is closed. The first-holder scan finished on 2026-10-17, covering blocks 19,663,982 to 26,207,480, which is the contract's full history on Ethereum. It needed roughly a day of continuous scanning and 901 days of transfers.
| Measured | Addresses | Read |
|---|---|---|
| Ever received $W on Ethereum | 26,714 | across 901 days |
| Holding it now | 9,598 | |
| Have left | 17,116 | 64.1% of everyone who ever held |
| Retention | 35.9% |
Roughly two in three addresses that ever held this token have gone. Of the 9,598 that remain, 1,487 hold $100 or more, so about 5.6% of every address that ever touched $W still holds a position worth something.
What this figure is and is not. It counts addresses, not people, and both sides of the ratio include contracts and exchange addresses. It measures first receipts rather than purchases, so an address that received during a spike and sold an hour later counts as having held. A retention figure of this kind has no absolute threshold attached: it is informative against the same token's history and against peers, not against a number invented here. Nothing in it says why anyone left.
One date stands out in the daily series. 250 addresses received $W for the first time on 2026-10-12, against 11 to 60 on the surrounding days. That is the day this report was published, and no causal claim is made about the two.
On comparing this with section 5. The position-size buckets above were measured on 2026-10-12 at a price of $0.0240. $W trades at $0.0138 today, so a count like "holders with $100 or more" moves with the price as well as with the holders. The two dates should not be read as a change in the holder base, and section 5 is left as it was measured rather than quietly restated.
7 · Provenance
Social data from LunarCrush over the period ending 2026-10-12, on a topic verified as genuinely about the token by reading its highest-interaction posts before any figure was computed. Peer ranks are against 41 same-size tokens drawn from a population of 130 whose topics were each verified the same way.
Chain data read from Ethereum via Blockscout, with the holder count cross-checked against a second source: 9,554 against 9,555, a 0% difference. Market data from LunarCrush and CoinGecko.
This audit was not commissioned, and no one associated with the project was contacted before publication.
A note on sample selection. The other published specimens scored 98/100 and came back manufactured, 21/100 and came back organic, 22/100 with one published claim that did not hold, and 25/100 on the week's biggest mover, the flattest crowd of 39 peers. All five are shown because a method that only ever finds problems is not measuring anything.